Kazakhstan’s Sustainability within the Asian Dryland Belt
Project Overview
Add introduction text
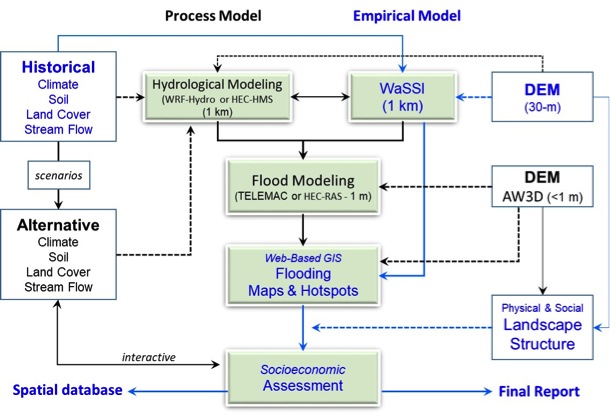
Conceptual diagram
Objective 1:
Objective 2:
Acknowledgements
Framework
Add text
Figure 1. Example map of study landscapes
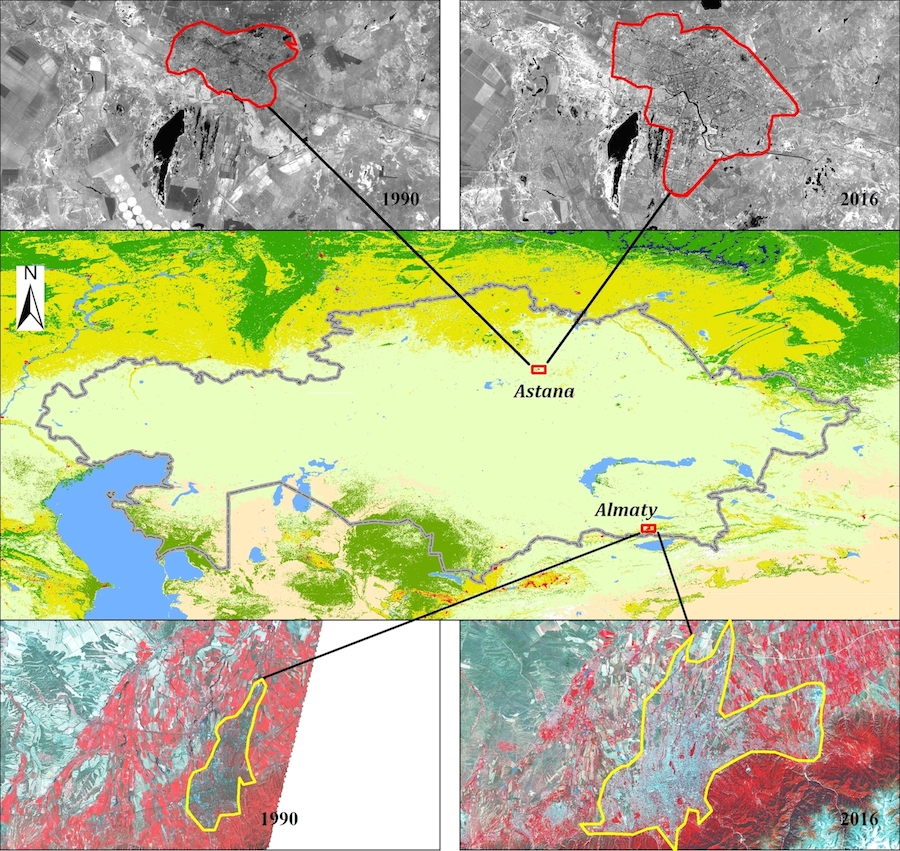
Figure 2. Landcover in Almaty and Astana, 1990 and 2016
Figure 3.
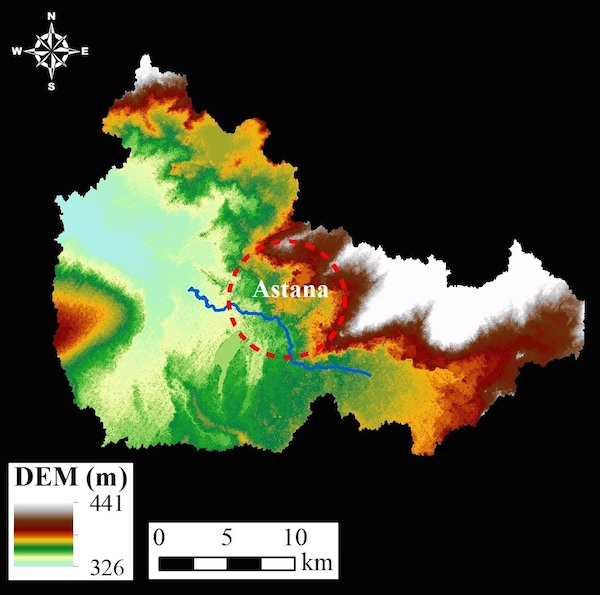
Figure 4.
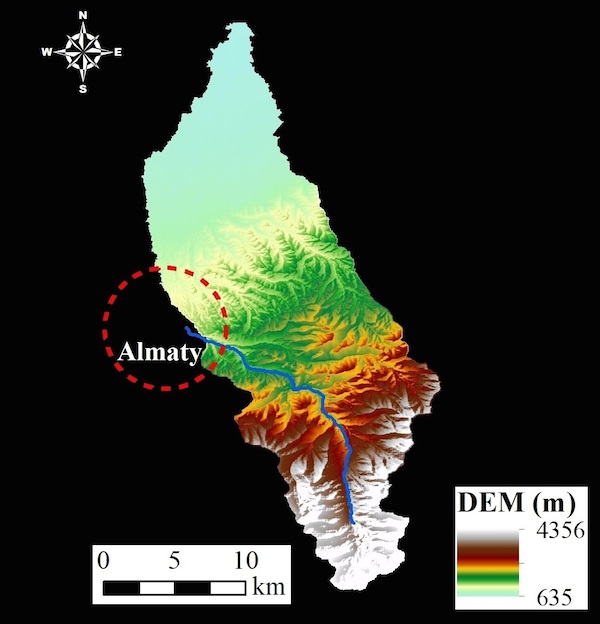
Figure 5.
Data
Background/Preliminary Data
- Mean annual precipitation | CRU 1900-2016
- Mean annual temperature | CRU 1900-2016
Team Members
Name |
Role |
Contact |
|---|---|---|
| Dr. Jiquan Chen | Professor, Principal Investigator | jqchen@msu.edu |
| Dr. Fei Li | Postdoctoral Research Associate | lifei6@msu.edu |
Contact
Center for Global Change and Earth Observations
202 Manly Miles Bldg. 1405 South Harrison Road Michigan State University, East Lansing, MI 48823